
Supply (quantity supplied) is the amount of a good or service that sellers offer for sale at a given price, at a given time. Supply is not the whole amount produced — only the part brought to the market.
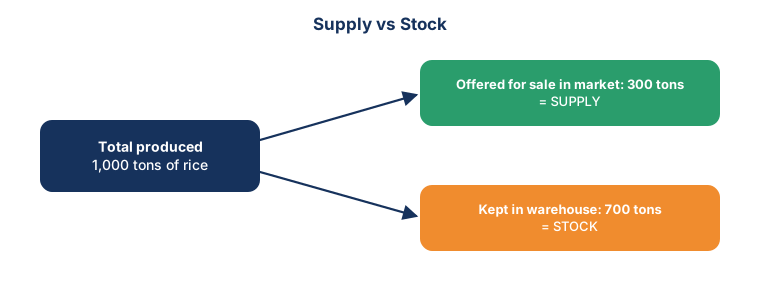
A farmer grows 1,000 tons of rice. He brings only 300 tons to the market at Rs. 650 per ton. Those 300 tons are supply.
The other 700 tons stay in the warehouse, waiting for a better price. That is stock (MCQ 32).
3.1 Law of Supply
“Ceteris paribus, when price rises, quantity supplied rises (extends); when price falls, quantity supplied falls (contracts).”
Price and quantity supplied have a DIRECT (positive) relationship.
Sellers want profit. A higher price means more profit per unit, so they produce and sell more. A low price is not worth the effort, so they sell less. That's why the supply curve slopes upward.
| Price (Rs. per ton) | 10 | 20 | 30 | 40 | 50 | 60 |
|---|---|---|---|---|---|---|
| Quantity supplied (tons) | 0 | 5 | 15 | 30 | 50 | 65 |
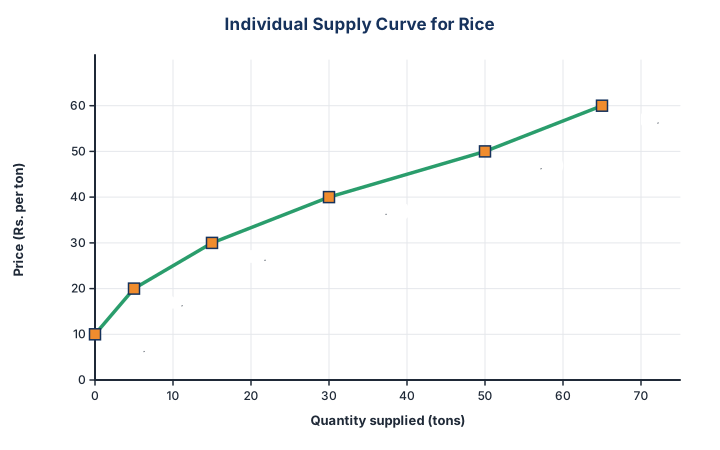
Each square is one row of the table. Joining them gives line S, which goes up from left to right.
At Rs. 10 the farmer supplies nothing (0 tons). At Rs. 60 he supplies 65 tons. Higher price → more supplied.
Assumptions of the law of supply
- Cost of production stays the same.
- Technology stays the same.
- No change in taxes or subsidies.
- Prices of inputs/raw materials stay the same.
- Prices of other goods (that the firm could make) stay the same.
Consumer income is a demand-side factor — it is NOT a condition of the law of supply (MCQ 7).
Change in quantity supplied vs Change in supply
| Change in quantity supplied | Change in supply | |
|---|---|---|
| Cause | Product's own price | Other factors (costs, technology, taxes…) |
| Graph | Movement along the same S curve | Whole S curve shifts |
| Words | Extension / Contraction | Rise (right) / Fall (left) |
Factors that SHIFT the supply curve
| Factor | Effect | Example |
|---|---|---|
| Input prices / resource costs ↑ | Costs up → profit down → supply falls (left) | Wages or cotton price rise |
| Better technology | Make more with fewer inputs → supply rises (right) | New machines in a factory |
| Higher (indirect) taxes | Cost up → supply falls (left) | GST increase on cigarettes |
| Subsidies | Cost down → supply rises (right) | Fertilizer subsidy |
| Prices of other goods the firm can make | Firm switches to the more profitable good → supply of the first good falls | Factory switches from ladies' handbags to school bags |
| Labour productivity ↑ | Workers produce more → supply rises (right) | Training improves output (MCQ 20) |
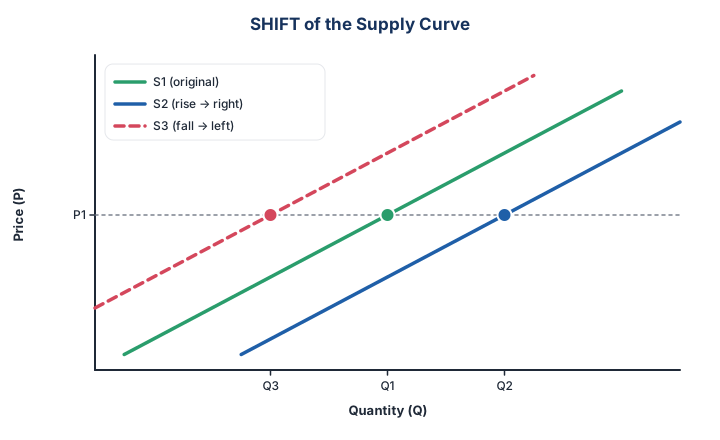
At the same price P1, sellers now offer a different quantity — so the curve has shifted.
S1 → S2 (right): rise in supply, e.g. better technology or subsidy. More is offered (Q2) at the same price.
S1 → S3 (left): fall in supply, e.g. wages rise. Less is offered (Q3) at the same price.
RIGHT = MORE (rise / increase). LEFT = LESS (fall / decrease). This is true for BOTH demand and supply curves.
A smooth supply curve applies to the product market; in factor markets the supply curve can have different shapes — e.g. the total supply of land is vertical because more land cannot be made (MCQ 23).