
There are two kinds of prices in markets:
| Type | Who decides it? | Example |
|---|---|---|
| Equilibrium / Market price | Market forces: demand and supply | Price of vegetables in a free bazaar |
| Regulated price | Government | Support price of wheat, petrol price set by govt |
4.1 Market Equilibrium
Equilibrium = a state of balance (rest). It is the price where quantity demanded = quantity supplied (QD = QS). On a graph, it is where the demand and supply curves cross.
A market is in equilibrium when: (1) no buyer or seller wants to change their decision, and (2) all their plans fit together and can all happen at the same time.
Think of a tug-of-war. Buyers want a low price, sellers want a high price. At the equilibrium price, both sides are happy enough — every buyer who wants to buy finds a seller, and every seller finds a buyer. Nothing is left over and nobody is left empty-handed.
| Price (Rs.000/ton) | QD (tons) | QS (tons) | Compare | Market position | Price will… |
|---|---|---|---|---|---|
| 50 | 5 | 15 | QD < QS | Surplus (10) | Fall ↓ |
| 40 | 7 | 13 | QD < QS | Surplus (6) | Fall ↓ |
| 30 | 10 | 10 | QD = QS | EQUILIBRIUM | Stay (neutral) |
| 20 | 14 | 6 | QD > QS | Shortage (8) | Rise ↑ |
| 10 | 19 | 1 | QD > QS | Shortage (18) | Rise ↑ |
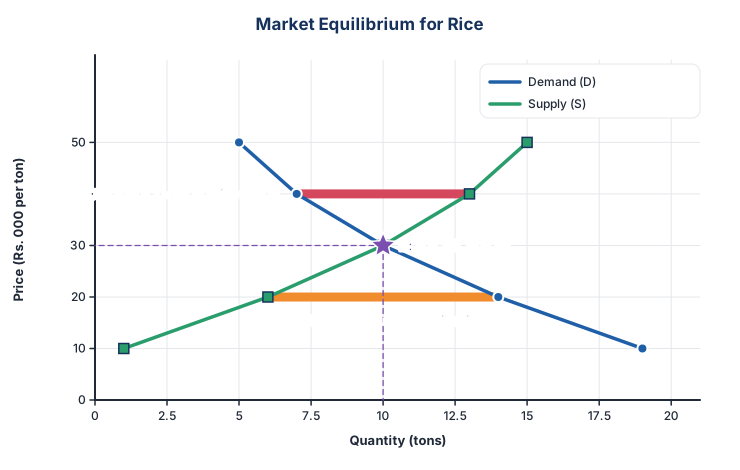
Blue = demand (from QD column). Green = supply (from QS column). They cross at the star: price Rs. 30, quantity 10 tons. That's equilibrium.
Red band at Rs. 40 (above equilibrium): sellers offer 13, buyers want only 7 → 6 tons unsold = surplus. Sellers cut prices → price falls back to 30.
Orange band at Rs. 20 (below equilibrium): buyers want 14, only 6 available → 8 tons short = shortage. Buyers compete → price rises back to 30.
The price mechanism
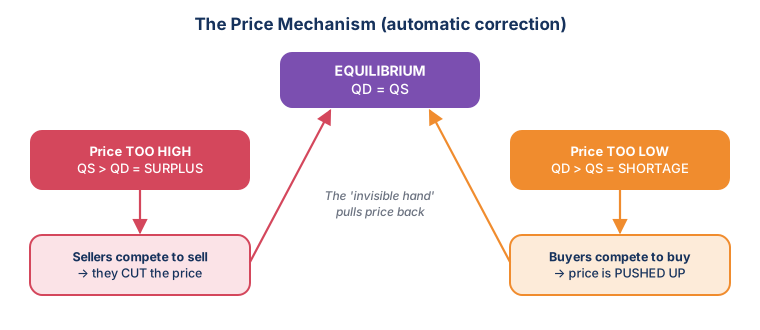
Whichever side the price starts on, the market pushes it back to equilibrium.
Too high → surplus → sellers compete → price falls. Too low → shortage → buyers compete → price rises. No government is needed — this is the automatic price mechanism.
ABOVE equilibrium → SURPLUS → price goes DOWN. BELOW equilibrium → SHORTAGE → price goes UP.
In the Graph Lab set a price above or below equilibrium and watch the surplus or shortage appear.