
So far we kept “other things” fixed (ceteris paribus). In real life, income, weather, fashion and costs keep changing. When they change, a curve shifts and the market finds a new equilibrium. There are four basic cases:
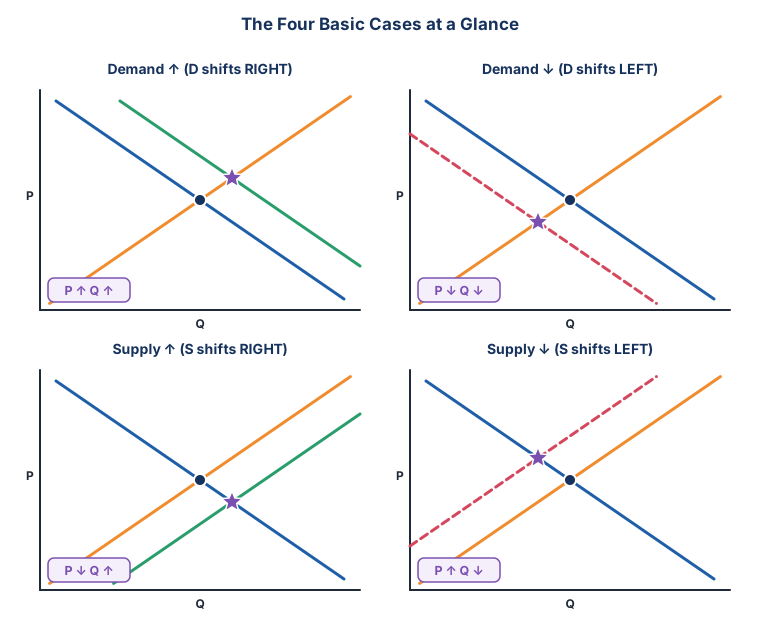
Top row: the demand curve moves (right = rise, left = fall). Bottom row: the supply curve moves.
Compare the dot (old equilibrium) with the star (new). The purple label tells you what happened to price (P) and quantity (Q).
| Case | Curve moves | Price | Quantity | Example from the chapter |
|---|---|---|---|---|
| Demand rises | D → right | ↑ | ↑ | Income rises → more chicken bought |
| Demand falls | D → left | ↓ | ↓ | Winter → fewer room coolers |
| Supply rises | S → right | ↓ | ↑ | New factory → more phones |
| Supply falls | S → left | ↑ | ↓ | Input prices up → fewer cars |
Demand shifts: price and quantity move in the SAME direction (both ↑ or both ↓).
Supply shifts: price and quantity move in OPPOSITE directions (one ↑, other ↓).
Case 1 – Rise in demand (chicken)
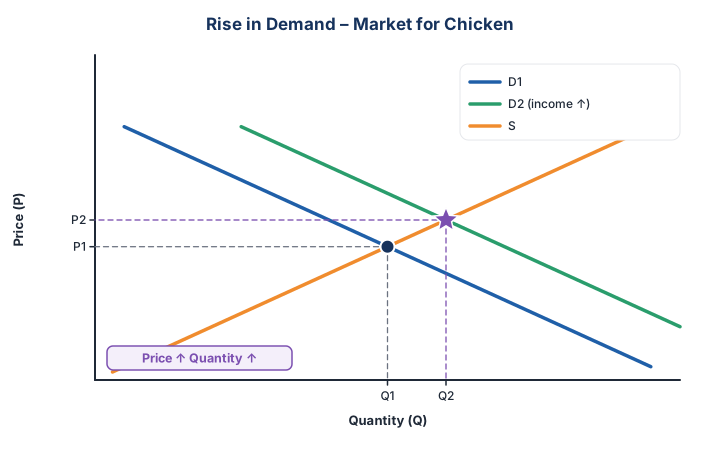
Income rises → people buy more chicken at every price → D1 shifts right to D2.
At old price P1 there is now a shortage, so price rises to P2. Higher price encourages poultry farmers to supply more (move along S).
New equilibrium E2: higher price (P2) and higher quantity (Q2).
Case 2 – Fall in demand (room coolers)
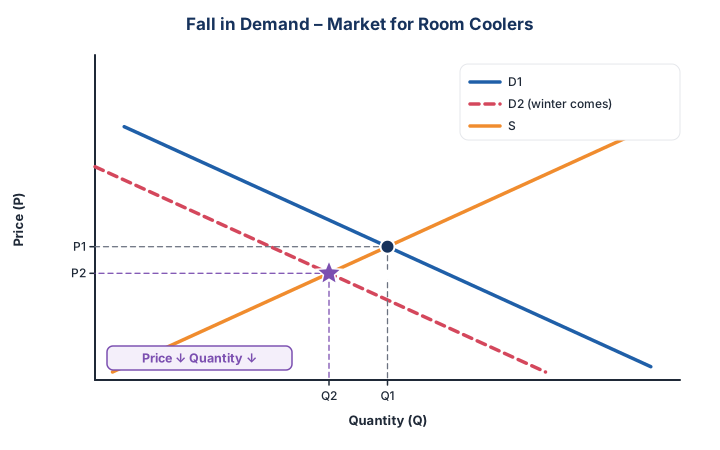
Winter arrives → people want fewer coolers → D1 shifts left to D2.
At old price there is a surplus, so sellers cut the price. Producers offer fewer coolers.
New equilibrium E2: lower price and lower quantity.
Case 3 – Rise in supply (mobile phones)
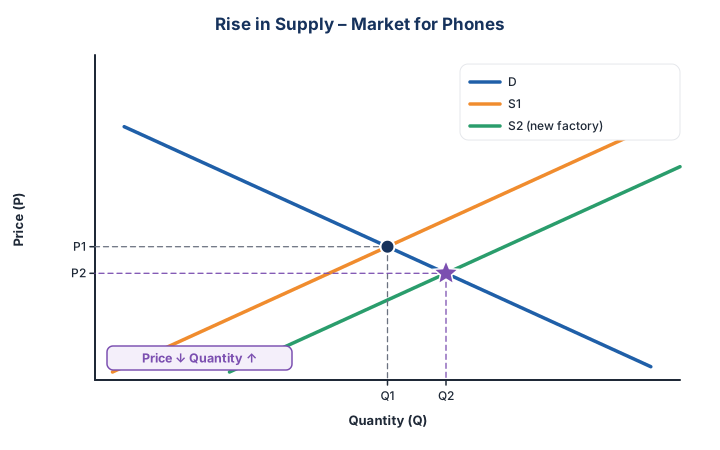
A new factory opens → more phones offered at every price → S1 shifts right to S2.
Extra phones create a surplus → price falls → cheaper phones attract more buyers (move along D).
New equilibrium E2: lower price, higher quantity.
Case 4 – Fall in supply (cars)
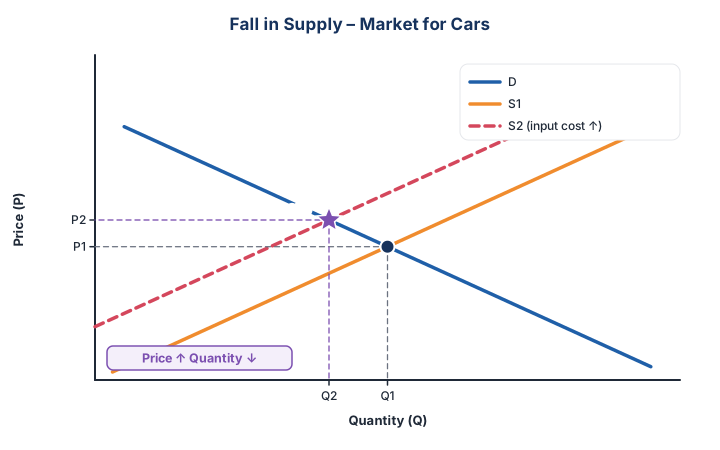
Input prices (steel, parts) rise → producing cars costs more → S1 shifts left to S2.
Fewer cars → shortage → price rises → higher price discourages some buyers (move along D).
New equilibrium E2: higher price, lower quantity.
Bonus: When BOTH curves shift together
Very common in MCQs. When both curves move, one result (price or quantity) is clear, and the other depends on which shift is bigger.
| Situation | Price | Quantity | How to think |
|---|---|---|---|
| Demand falls MORE than supply falls | ↓ (demand wins) | ↓ (both push it down) | Both shifts reduce quantity. Bigger demand fall drags price down. (MCQ 4 → a) |
| Supply falls MORE than demand falls | ↑ (supply wins) | ↓ | Both reduce quantity. Bigger supply fall pushes price up. (MCQ 11 → d) |
| Demand rises and supply rises | Depends | ↑ | Both increase quantity |
| Demand rises and supply falls | ↑ | Depends | Both push price up |
Move both sliders in the Graph Lab to see a double shift, or test yourself in the Shift Simulator.